We Reduced our Energy Consumption, and You Can Too
- Share on:
-

-

-

-

-

By Max Dalton
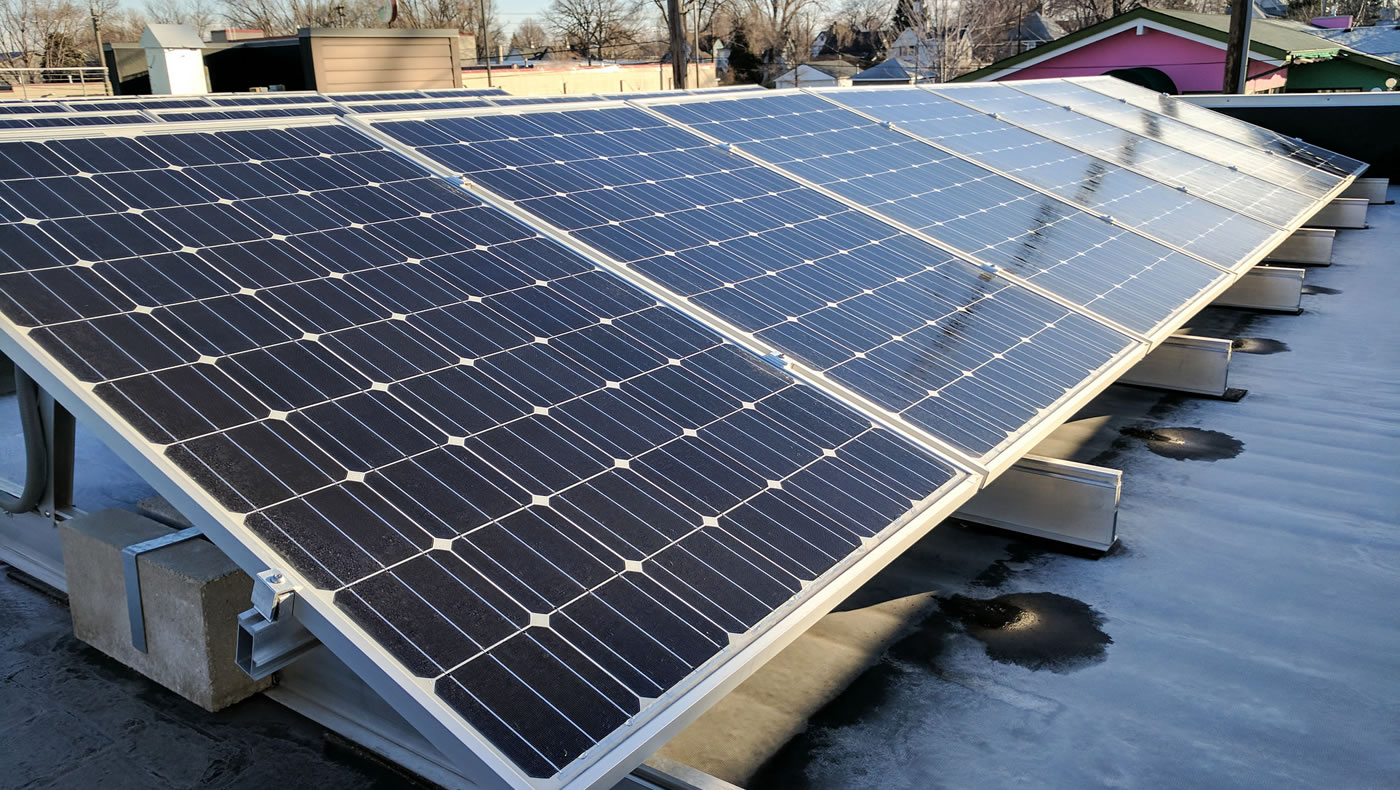
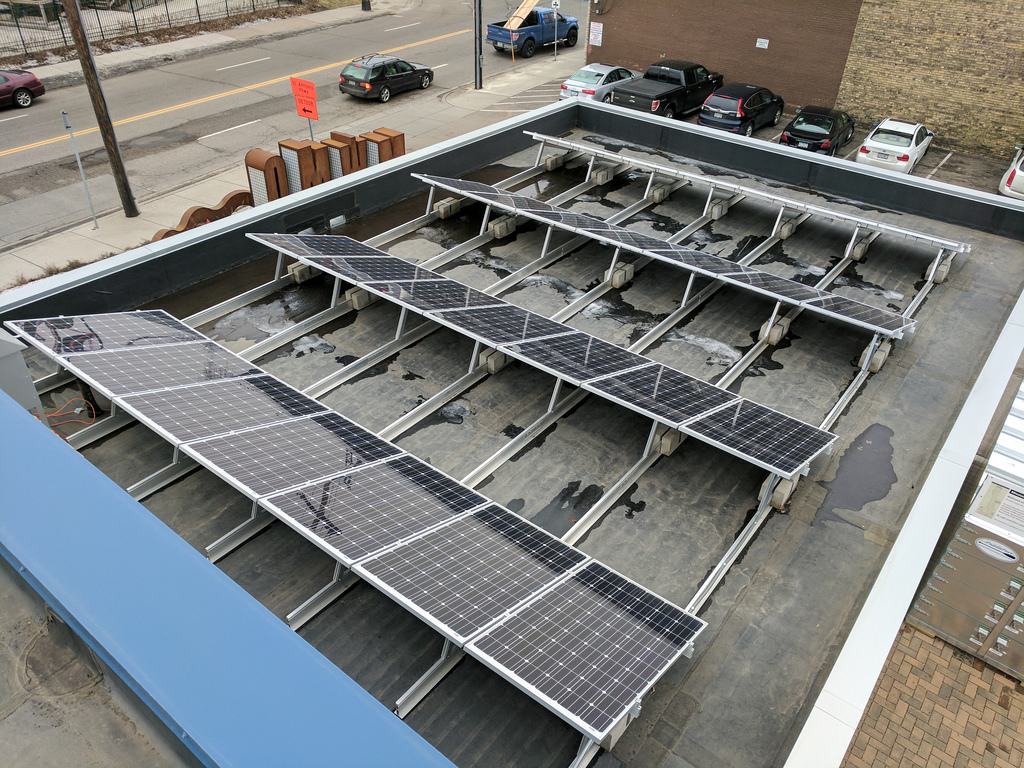
It has been exactly one year since our solar array began producing electricity here at our Stormwater Park and Learning Center, and it is already adding to our bottom line. Installed by All Energy Solar (with support from a Made in Minnesota grant from the Minnesota Department of Commerce), our solar photovoltaic system allows us to generate clean, renewable power on site and — just as important — monitor how much we consume. We’ve taken that information and used it to find ways to be more energy-efficient in our everyday work. It has been my personal favorite project here at the MWMO, and there’s a version you can do at home too.
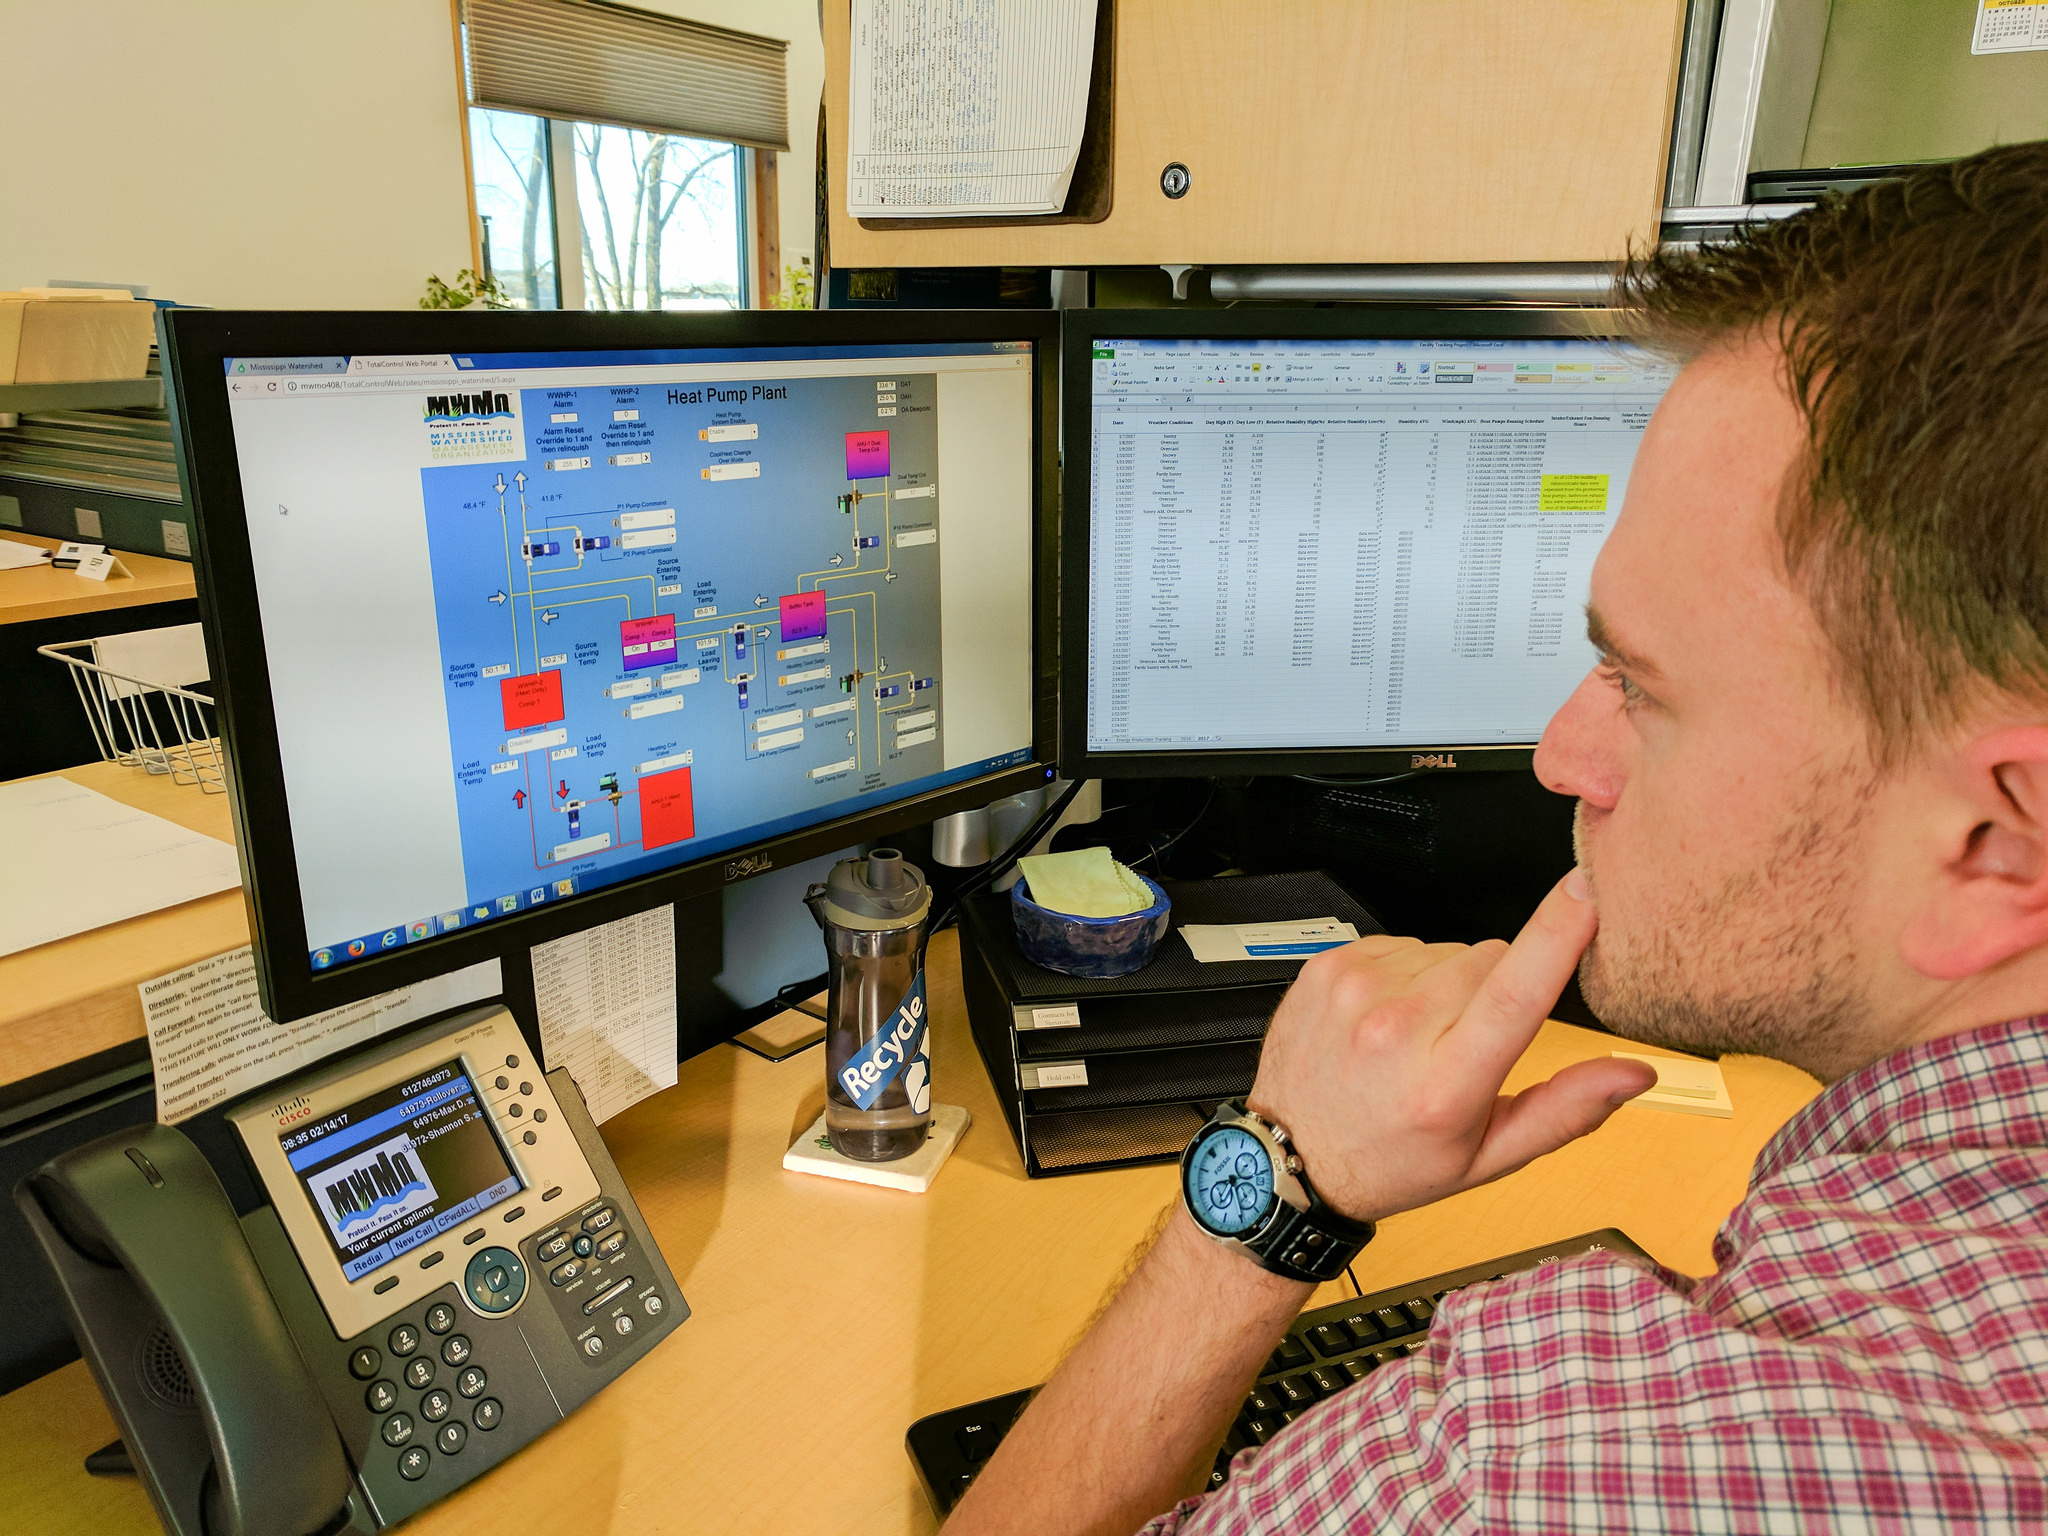
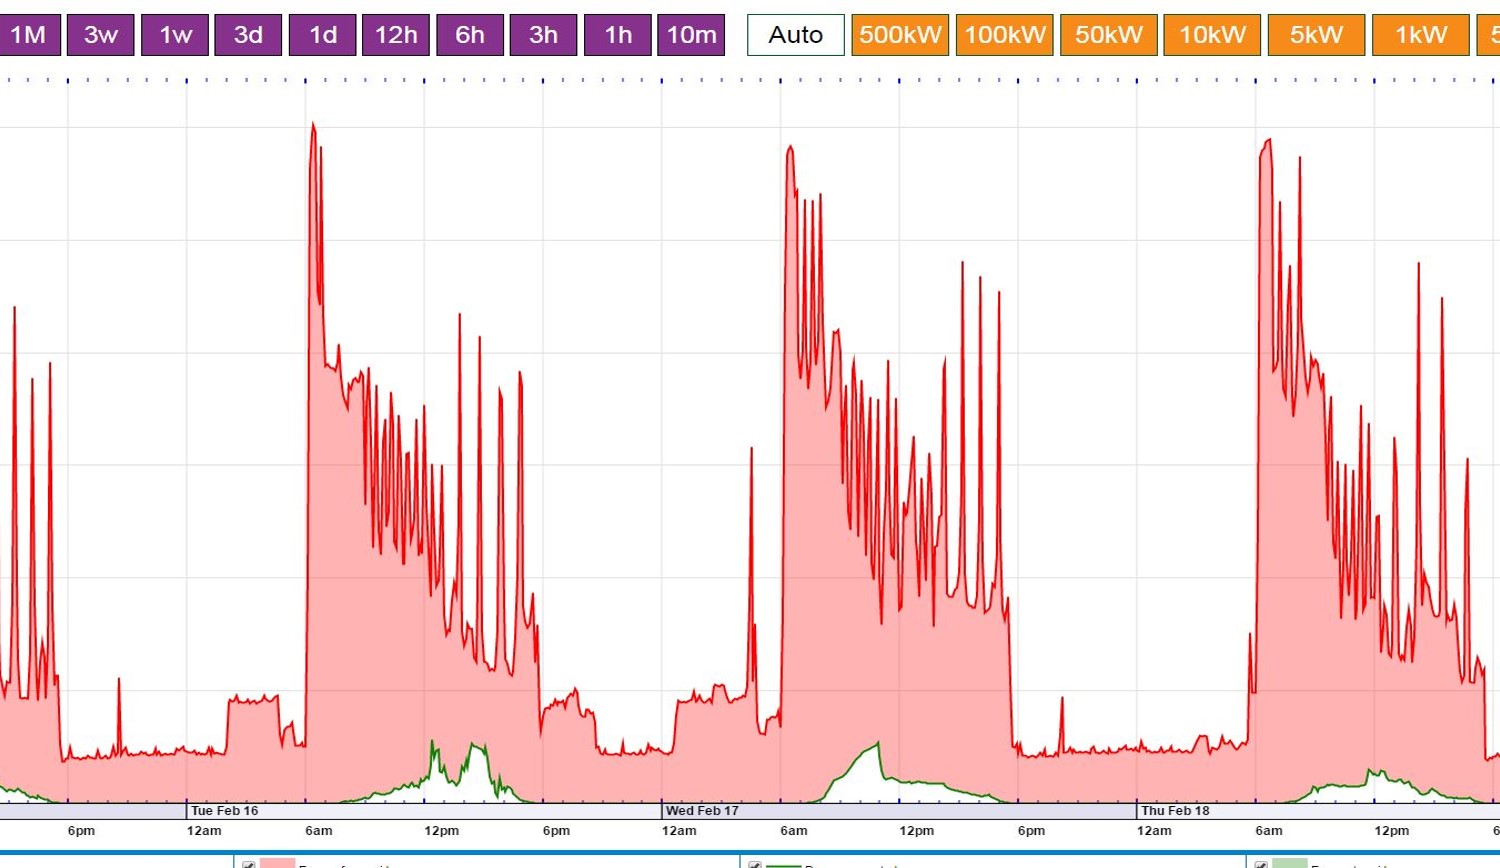
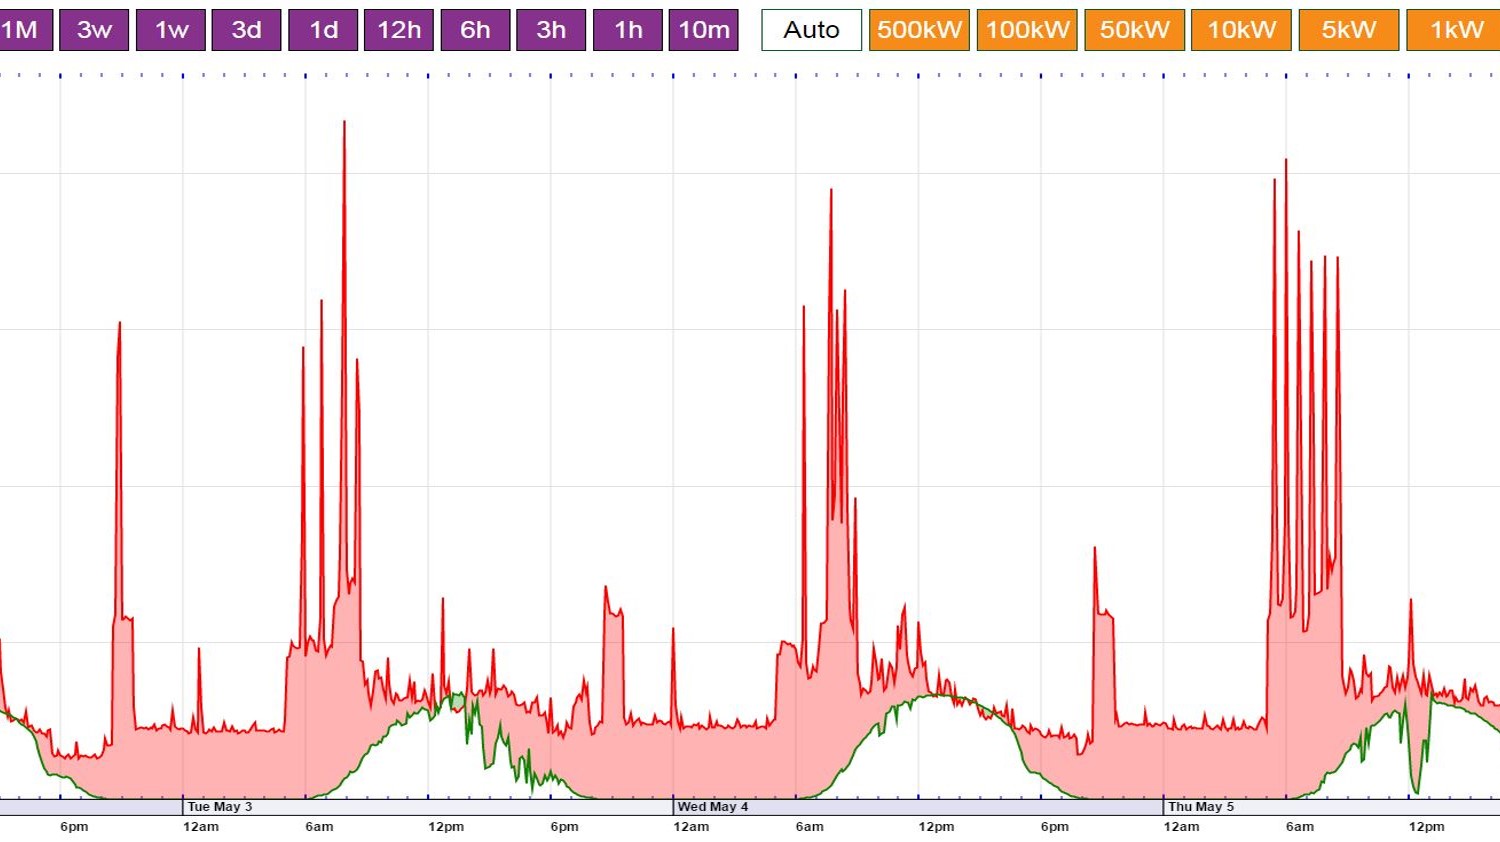
Here at the MWMO, thanks to a web-based tool called eGauge, we can track and compare the amount of energy that we’re consuming with the amount being generated by the solar panels. (You can see a live, real-time feed from the system here.) In a mad scientist sort of way, we’ve been using this system to experiment with our facilities by finding ways to use less energy.
Starting last March, we modified some of our daily routines and habits in order to maximize our energy efficiency. We kept detailed notes and monitored the results of each change. By May, we had implemented a more comprehensive tracking system and began making permanent changes. We tracked everything from which lights and appliances were turned on to changes in the building’s temperature and the settings on our geothermal heating and cooling system. From this, we created a database of information to help us predict how best to run our facilities under various conditions.
It might sound complicated, but it’s actually a very simple concept: come up with ideas to save energy, try them out, and stick with the ones that work. The impact on our monthly electric bill was immediate, and can be seen in the chart below.
| Year | Average Monthly Electric Bill* |
| 2013 | $1,081.79 |
| 2014 | $1,165.15 |
| 2015 | $1,136.01 |
| 2016 | $976.08 |
*For apples-to-apples comparison, includes only the months of May through December of each year.
As you can see, our monthly electric bill has dropped by $100-$200! This might seem modest, but it’s important to note those figures don’t include income generated by the solar panels. (Under the terms of our Made in Minnesota grant, we receive a payment once per year for 10 years based on the amount of electricity produced by the array. After this 10-year period, the production will be included on the bill.) This means that our electric bills are dropping based solely on the behavior of our staff and the operational changes we made from our experimentation.
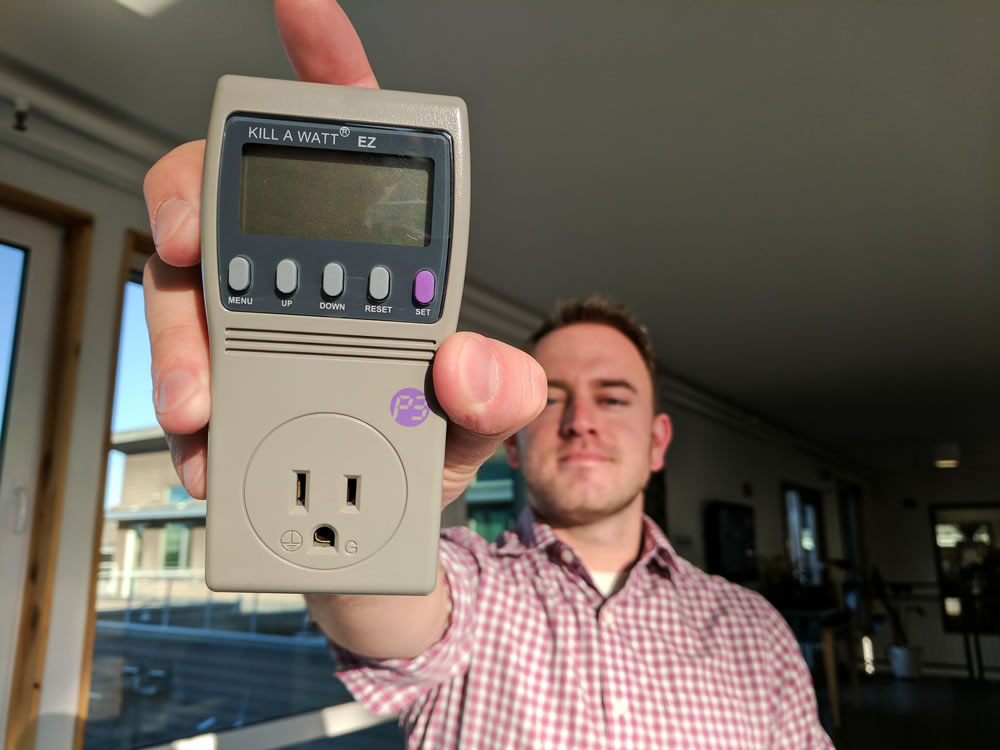
You can do this kind of experimentation at home, even without solar panels or high-tech software. For between $15–$35, you can buy a power usage monitor that plugs into your wall outlets. (You can also borrow one for free from your local Hennepin County Library.) These devices and let you monitor how much electricity your individual appliances and electronics use, and most are able to calculate the resulting cost on your electric bill.
My advice: get a power meter, try it on everything you have plugged in and find ways to use less energy and save yourself some money. You might be surprised to find out how much energy in your house is being wasted by things as trivial as cell phone chargers that are left plugged in when no one is using them.
Solar Energy Production
Although we won’t receive our first check for producing any solar energy until later this year, we do know how much the system is producing. Through a system called Enphase, we can see and quantify the productivity of the array. As of Feb. 1, 2017, our solar panels have produced 9.3 megawatt hours of electricity.
How much is that, you ask? Electricity production and use can be expressed in several different ways — some of which can be hard to understand. To put it into simple terms, 9.3 megawatt hours is equal to the amount of electricity in 3,113,799 AA batteries. It’s also equal to the amount of energy required to:
- charge your cell phone for 289.8 years;
- run a refrigerator for 5.7 years; or
- power a light bulb continuously for one month a year for 82.5 years.
Yet another way to think of it: our solar panels have offset enough carbon emissions in their first year of operation to equal 170 planted trees!
Of course, it is important for us to recognize that the weather plays a factor in our relative success or failure in becoming energy efficient. We can make all the changes we want, but on a sunny, humid, 100-degree day in July — or a cloudy, windy, -20 degree day in January — we will always have less control over how much energy we use and produce. Still, no matter what the weather does, we can always find ways to work with Mother Nature instead of against her.
As an organization, our focus will always be on stormwater and protecting the Mississippi River. But we also strive to be good stewards of the environment as a whole. With the information our system provides, we will continue to find ways to use less power and give more back to the grid. At the end of the day, we all recognize that collective efforts are important and we challenge others to join us in not only protecting our water but being stewards for our environment.
See also: Little by Little, Going Greener at the MWMO

- Share on:
-
-
-
-
-